

|
Reach Out
How can we help with your logistics needs?
|
Over 1,700 clients and 98% satisfaction
98% on time project deliveries
Over 107,000 successful shipments
|
What is a Gantt chart? A Gantt chart is a visual view of tasks and activities scheduled over time for a project. They are used for projects of all sizes and show what work is to be done at a specific time, how tasks relate and overlap, and visually represent the progression of each individual […]
A Gantt chart is a visual view of tasks and activities scheduled over time for a project. They are used for projects of all sizes and show what work is to be done at a specific time, how tasks relate and overlap, and visually represent the progression of each individual component of your project.
Gantt charts are especially useful in keeping a project on schedule and tracking task dependencies. When there are many moving parts to a project — and certain components of a project are triggered by the completion of others — this chart helps project managers view progress at-a-glance in one easy-to-read, organized, and color-coded chart to ensure nothing slips through the cracks.
Managing a project can be a daunting task, especially if you’re managing multiple teams, sequential deliveries, and working hard to keep everything on schedule and running smoothly.
For this reason, Gantt charts have been created to track the following:
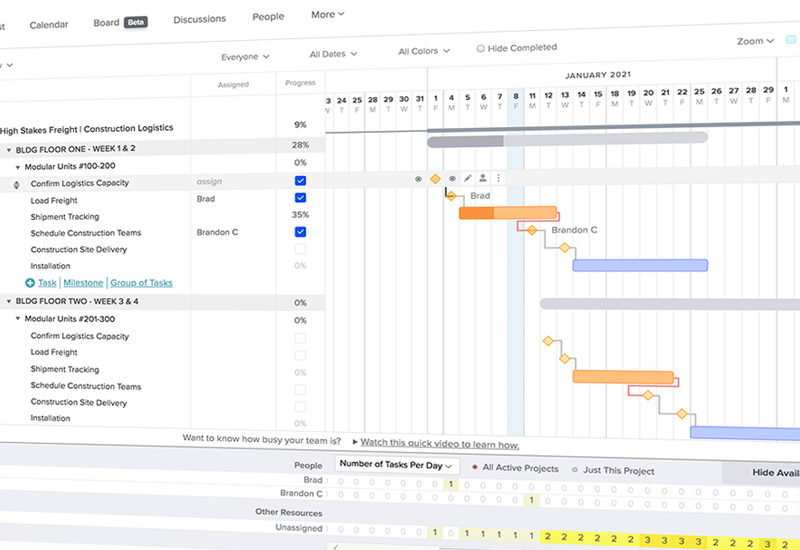
A Gantt chart is a dynamic and collaborative place with a simple layout. Tasks are listed on the left and can be organized categorically, while a waterfall timeline appears on the right to illustrate how tasks are progressing in real-time.
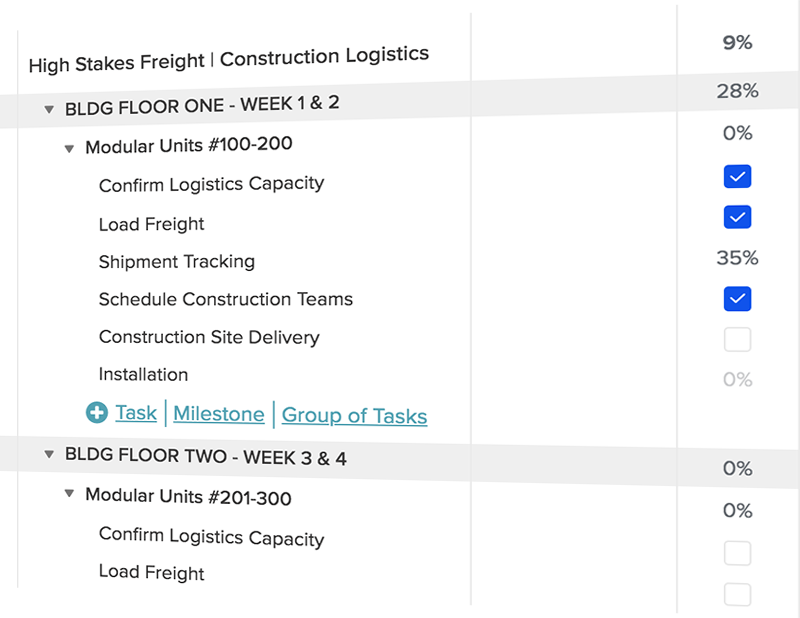
Every project is made up of tasks, which are then organized into phases and milestones. By creating milestones along the way, you make sure that you hit your most important deadlines.
Phases of a project are chronological and are made up of sub-tasks, the last one typically being considered a milestone for that particular phase. These phases can be color coordinated so they’re easily distinguished in your waterfall timeline.
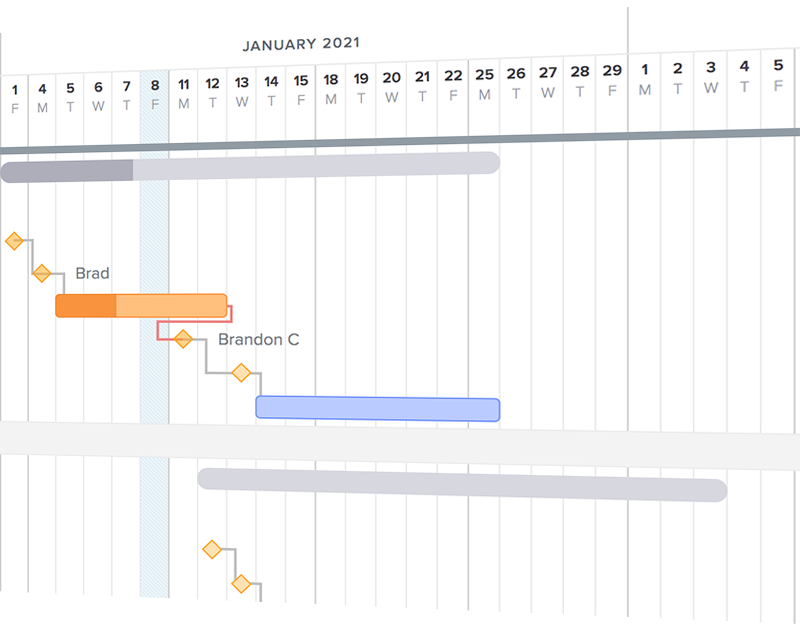
Tasks can be set up so that one cannot begin until another is finished, again ensuring that nothing is left to the wayside during your project. Simply link tasks together based on their dependencies and set them to track accordingly.
Once your Gantt chart is populated with your tasks, phases, and milestones, it’s easy to assign tasks to the team members responsible for completing them.
Gantt charts also serve as a one-stop-shop for important information regarding tasks, as notes and documents can be linked within each task for easy reference on our favorite online platforms (more on this later).
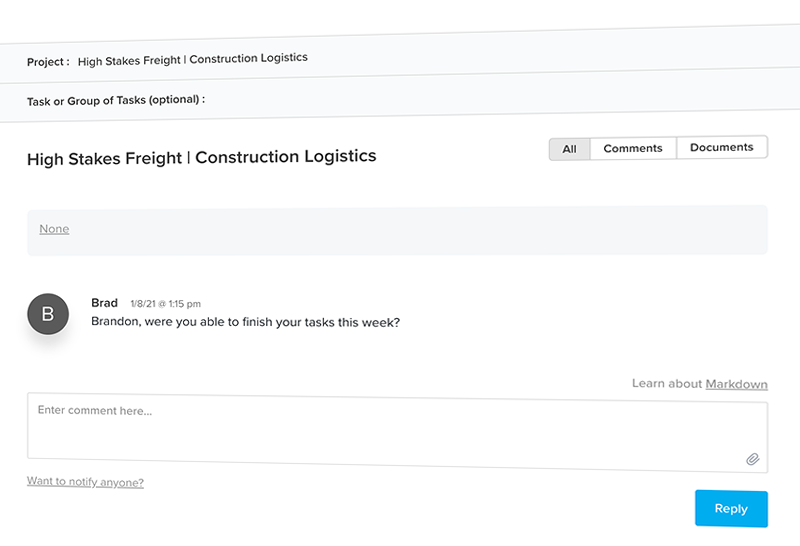
Additionally, team members assigned to tasks are able to view their tasks without needing to see the overall project. They’re also able to request support and update their progress, which is then reflected in the project dashboard.
Projects typically have many moving parts and tasks being completed simultaneously. For project managers, this may mean multiple points of contact, communications across a variety of teams, different complexities to consider for each task, and lots of files to keep track of and organize.
As a project manager, you can’t afford to spread yourself thin across multiple communication platforms (email, text, calls, etc), and have different methods of file sharing and progress tracking for each team on a job. This certainly causes unnecessary stress and frustration. Gantt charts are easily shared and updated in real-time, so the latest information about the project can be accessed at any time, anywhere. Because of this, even the smallest delay can be spotted instantly and resolved before it becomes a big problem down the road.
If you are a project manager, Gantt charts are perfect for all of your key needs:
As a project manager, you can’t afford to spread yourself thin across multiple communication platforms (email, text, calls, etc), and have different methods of file sharing and progress tracking for each team on a job. This certainly causes unnecessary stress and frustration. Gantt charts are easily shared and updated in real-time, so the latest information about the project can be accessed at any time, anywhere. Because of this, even the smallest delay can be spotted instantly and resolved before it becomes a big problem down the road.
In the world of construction, the project supply chain is dependent on the on-time transportation and logistics of materials. For example, if the timeline and sequential order of delivered materials is delayed, the construction schedule will be impacted. If the completion (or incompletion) of certain tasks are not documented and organized in real-time, the results could be costly—and messy.
When it comes to construction logistics for High Stakes Freight (learn more about what that means here), it’s critical to deliver items that are on time, in sequence, and intact. But if teams are disorganized, tasks are overlooked or left incomplete, communication is unclear, and procedures aren’t followed chronologically, there is something bound to go wrong in the supply chain.
Gantt charts are an important tool for project management to integrate all the moving parts of the logistics for a construction project and make important labor scheduling decisions based on the transportation and flow of important materials and products.
Construction logistics are an integral part of a project plan.
Whether it’s the transportation and delivery schedules, bridging communication with manufacturers, suppliers, and the onsite construction team, or troubleshooting unexpected circumstances on the fly, an expert freight shipping team is required to keep the supply chain running smoothly.
For construction logistics, a project manager can use a Gantt chart to:
Are you ready to create your own Gantt chart for construction logistics and your supply chain?
Start by organizing your project into manageable parts. Ask yourself:
When you’ve outlined the scope of your project, read this guide to learn how to create your Gantt chart in Excel. You can even start with a template and modify it as needed along the way.
Want an even easier route?
There are online tools available to create a customized Gantt chart with additional features. Our teams’ favorite is Team Gantt because they offer a simple user interface, collaborative online platform, an interactive chart maker, the ability to communicate with collaborators within the platform, and a place to store task-related documents.
Are you a project manager in need of a rock-solid construction logistics plan? Contact us for a customized proposal where we’ll scope out your perfect freight shipping solution and discover how Stream Logistics can help make your supply chain a success.
|
Share this Article
|
|
Reach Out To
Learn More
|
Over 1,700 clients and 98% satisfaction
98% on time project deliveries
Over 107,000 successful shipments
|
|
Newsletter
Sign up to stay updated
|
Over 1,700 clients and 98% satisfaction
98% on time project deliveries
Over 107,000 successful shipments
|